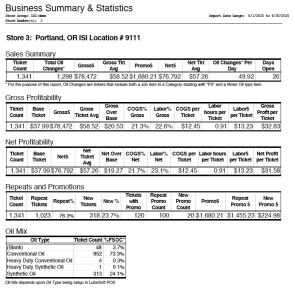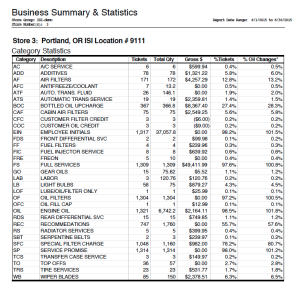
Five tables are provided in the report to show Sales Summary, Gross and Net Profitability, Marketing and Repeat customers, Oil Mix, and Category Statistics.

Sales Summary
Shows helpful sales metrics including Tickets, Oil Changes, Gross Sales, Promotions (coupons and discounts), and Net Sales and Ticket Average.
Gross and Net Profitability
Displays store profitability during selected period. These metrics help the operator pinpoint areas of improvement needed for the store.
Promotions and Repeats
Shows metrics related to the coupons and discounts used by new and returning customers. These metrics allow the operator to evaluate the effectiveness of specific promotions and examine how repeat customers are welcomed back to the store.
Oil Mix
Uses the Oil Type fields setup on oils within LubeSoft to examine the number of each type sold and show a breakdown of the percent of oil changes by Oil Type sold.
Category Statistics
Lists each category where a Part, Motor Oil, Wildcard, or Other type item was sold within the date range. This allows the operator to assess the number of tickets in each category and total quantity sold. There is also the ability to evaluate the percentage of tickets and the percentage of oil changes in each category sold.
The Business Summary and Statistics report is available on a store-by-store basis. The ability to group stores in the report is coming soon.
